 Equine Sensor
Loss of movement in the right hind leg.
Lands 27% more softly, recovers 10% more slowly.
What the eye misses,
measured.
Sensors on all four legs record every stride thousands of times per second; the recordings are interpreted centrally by AI. How the horse carries its weight, whether it is favouring a leg, and how that pattern shifts over time — gathered into a single report.
Book a measurementMeasurement in three steps.
Under half an hour on site. The hard part is not the measuring — it is making the measurement repeatable. That side of the work is ours.
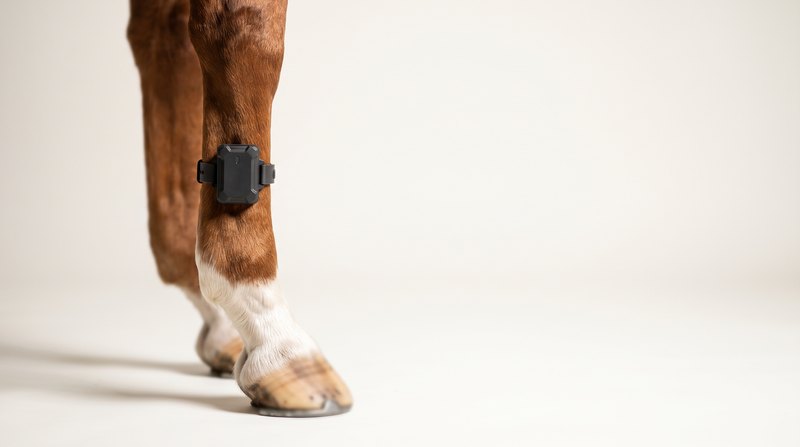
Sensors go on
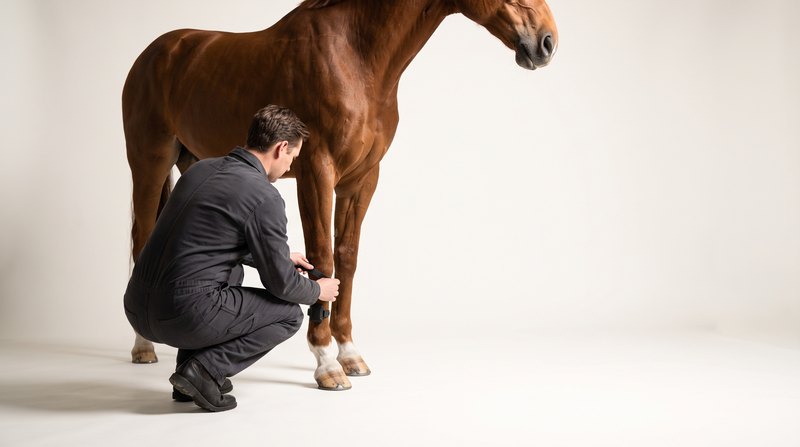
One sensor on the cannon bone of each leg. Fitting takes five minutes; no shoes, bandages or sedation needed.
Recordings are taken
Walk and trot with an operator, in a straight line and on a turn. The surface is noted on every recording — concrete and an arena do not give the same numbers.
The report comes out
Each leg on its own, front and hind pairs side by side. When comparing with the past, only recordings from the same conditions are placed together.
How the horse uses its legs.
Not isolated numbers, but a pattern of behaviour. The measurement makes visible how weight is shared between the four legs, whether one of them is being favoured, and whether that pattern changes over time.
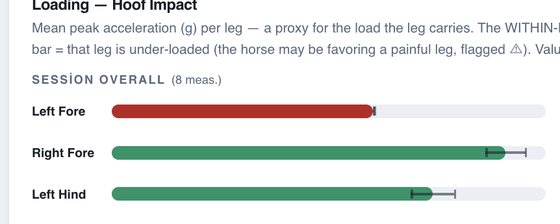
Load balance
How weight is distributed between the legs. Avoiding one leg turns into extra load on the others; that shift is recorded.
The difference between right and left
One leg's value says little on its own; the distance to its pair does. Pairs are compared at every measurement.
Movement pattern and joint behaviour
The path a leg follows through the stride, and how closely it repeats from one stride to the next. It gives an indication of joint structure and freedom of movement.
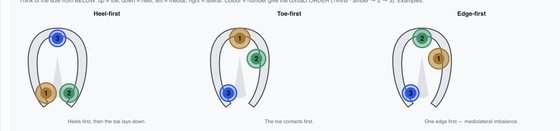
How the hoof meets the ground
The way the foot arrives at the ground. The result of shoeing and trimming shows most clearly here.
Change over time
Comparison of recordings taken under the same conditions. What moved in a week, what stayed put across a season.
FOUR LEGS SIMULTANEOUSLY · HIGH SAMPLING RATE · RAW DATA IS KEPT · NO SINGLE MEASUREMENT IS A DIAGNOSIS
The measurement stays fixed; the reading improves.
A number carries no meaning until you know the conditions it was taken under. So every measurement follows a predefined protocol: surface, gait and distance are not left to the session — they are written down. That is precisely what makes comparison possible.
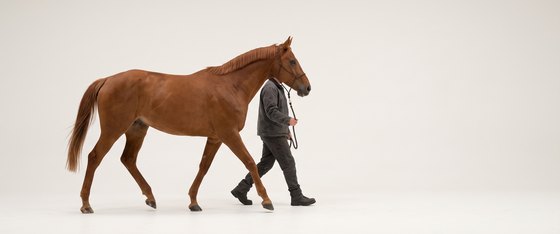
Standard conditions
Surface, gait and distance are set by the same protocol every session and written into every recording. Two measurements taken on different surfaces never enter the same average.
Norms
Measurements are assessed together centrally. Norms are being built for variables such as breed, age and discipline; the aim is for a horse's value to be read within the spread of its own group. As records accumulate, the thresholds sharpen.
Re-reading
Raw data is kept. Whenever the analysis improves, past measurements are recomputed with the new method — a recording made months ago is read again with what we know today.
That is why a measurement is not a one-off document: it is a record read again with every round of learning.
What does the report look like?
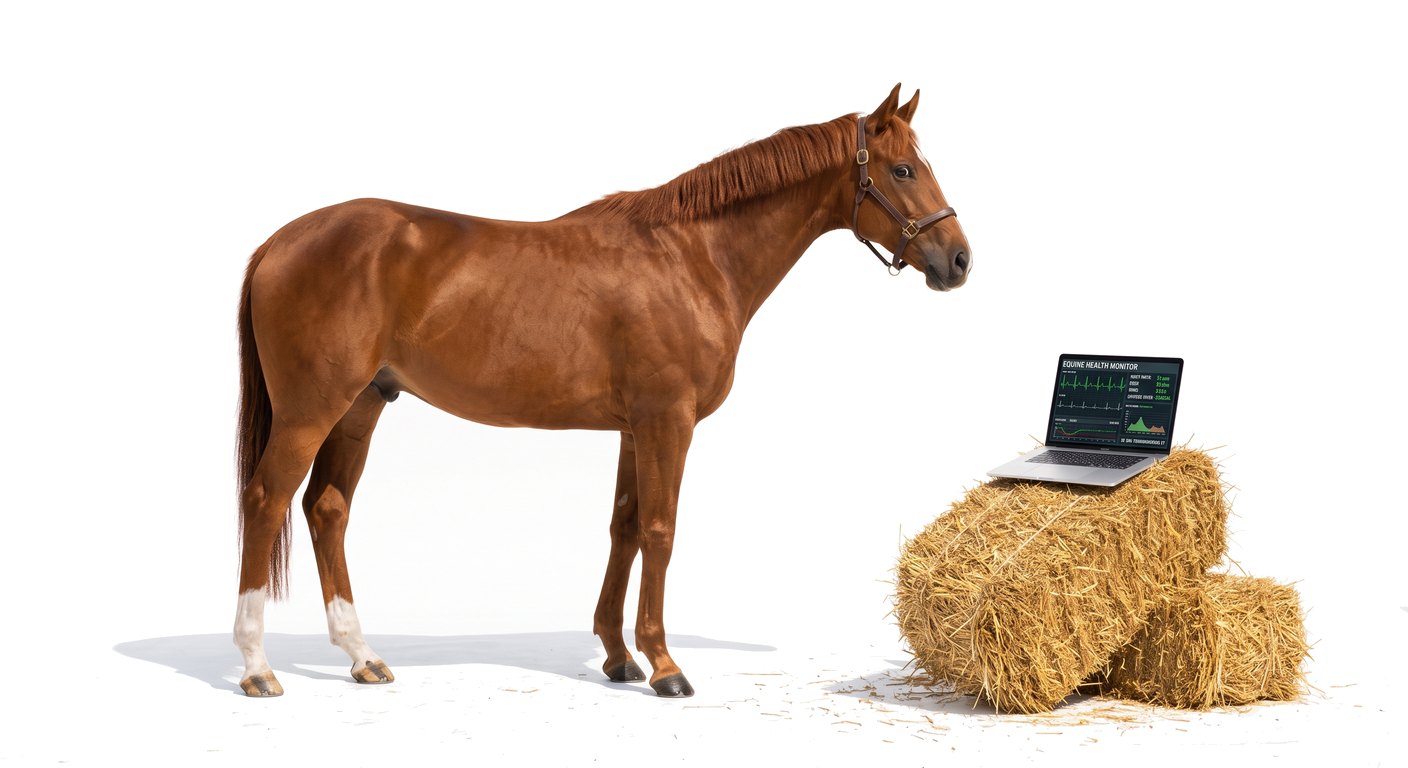
Every measurement lands in an analysis panel that opens in the browser. These are real screens; under each heading it says how that number should be read.
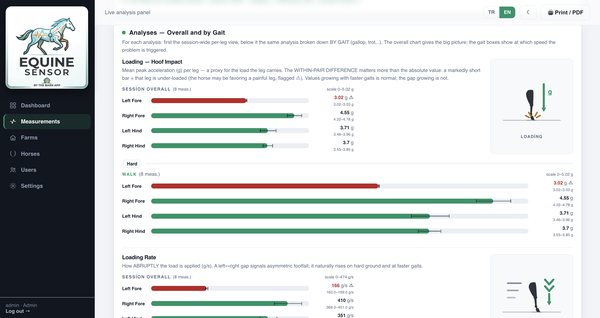
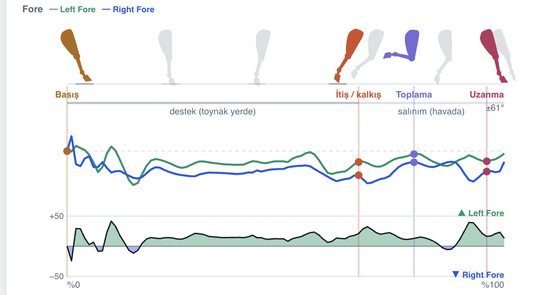
One measurement, three different questions.
One report. What changes is the question the reader brings to it.
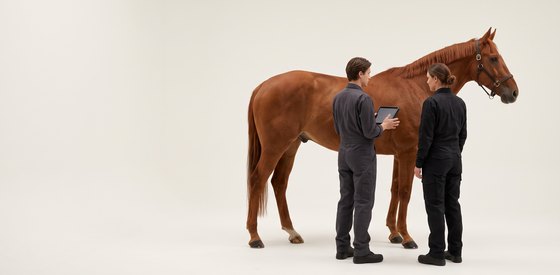
Veterinarian
A numerical record alongside the examination. The grading stays yours; the measurement leaves a dated, re-readable baseline underneath that observation.
Farrier
Before and after shoeing, two measurements on the same surface. The result of the work shows in how the horse sets its foot down.
Trainer
The horse measured against its own history. What moved in a week, what stayed put across a season — and spreading the workload accordingly.
We bring the equipment.
We do not sell devices; a trained operator runs the measurement. Fitting the sensors correctly, noting the conditions and validating the data is the most fragile part of the job — a clean report cannot come out of dirty data, so we do not leave that step to you.